Overview
Remesh offers a variety of metrics and measures to be used to quickly organize and analyze your data. This article provides an overview of each of these metrics, how they work, and best practices on how you can use the data.
Included in this article:
- Metrics & Measures at a Glance (comparison chart)
- Percent Agree
- Highlights
- Categories
- Common Topics
- Sentiment Analysis
- Thematic Clusters
- Ranking
Metrics & Measures at a Glance
The chart below gives you a snapshot comparison view of the various metrics and measures available to you in the Remesh platform.
| % Agree | Highlights | Categories | Common Topics | Sentiment | Thematic Clusters | Rank Weighted Score | |
|---|---|---|---|---|---|---|---|
| What does it do? | Estimates % of the audience that agrees with the response | Provides a spread of responses | Organizes responses into researcher-defined groups | Surfaces important keywords that frequently appear | Assigns "Positive". "Neutral", and "Negative" to responses | Organizes responses into system-defined groups | Determines a best fir rank order, and sows options voting distribution |
| Used for? | Sorting, reading,& selecting key responses | Getting a big-picture overview of the response spread | Identifying themes by letting the audience assign groups | Identifying themes by leveraging the similarity of single keywords or short phrases (1-3 words) | Understanding the emotional direction of responses | Identifying themes by leveraging the similarity of full responses | Getting a breakdown of preference order and voting distribution |
| Question Type? | Ask Opinion Branching | Ask Opinion Brancking | Ask Experience | Ask Opinion Branching and Ask Experience |
Ask Opinion Branching and Ask Experience | Ask Opinion Branching and Ask Experience | Rank |
Percent Agree
Highlights
What it is: The “spread of opinion” or a selection of thoughts in which each participant is most likely to find a thought they strongly agree with.
Where you can find it: Highlights is available for both Live and Flex products and can be found in the “Live” tab. For the Live product, you can access Highlights as the conversation is happening and after it ends. For Flex, you can only access highlights after the conversation ends.

How it works: Highlights show up to 10 responses for each question. The number next to each response represents the number of participants that most optimally prefer and agree with that response over the other 9 displayed. This number is informed by both the prefer and agree voting exercise data.
Here’s a great example using pizza and sushi that shows how this works and how it brings polarizing responses to the surface.
How to use this data: Bring opinions that have significant factions of support to the foreground. You can also choose to “Star” these responses if you want to reference them later.
Categories
What it is: A way to group open-ended Ask Experience responses together. The category names are defined by you, the researcher, and selected by participants after they type their responses.
Where you can find it: You first create Categories when you’re building your Discussion Guide — for Ask Experience questions, you’ll define both the question and the Categories your participants can choose that best matches their response.
In your Analysis Results, ‘Category’ appears as a column with a drop-down menu containing all categories. You can also analyze Categories during a Live Conversation.

How it works: In Ask Experience questions, participants are asked to select a Category that best represents their response. This provides you, as the researcher, with the open-ended response they type as well as a general Category for analysis. Think of it as a hybrid between a poll and an open-ended question. This self-categorization is done instead of the voting exercises in Ask Opinion questions.
How to use this data: Capture verbatim feedback without voting — either because of preference or because it doesn’t make sense for your question — while still getting organized responses for analysis.
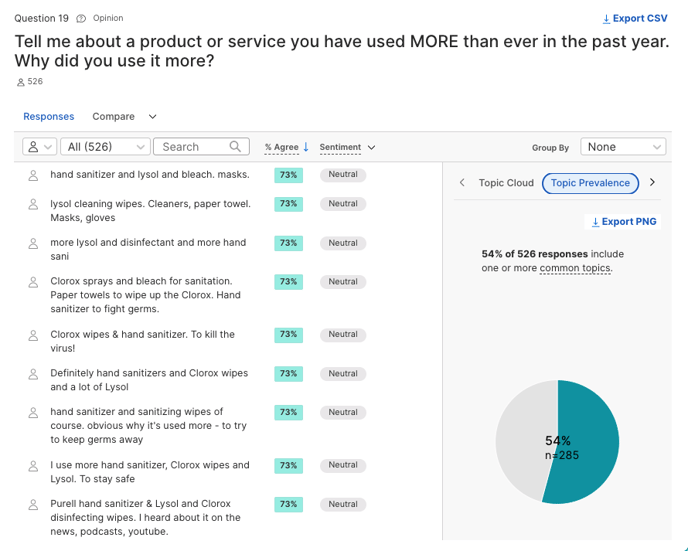
Common Topics
What it is: The prominent words and phrases that arise repeatedly in responses to a specific Ask Opinion question.
Where you can find it: In the Live view for each Ask Opinion question while Remesh Live and Flex Conversations are taking place, as well as in the Analysis Results after Conversations are complete for both Ask Opinion and Ask Experience questions.


How it works: Remesh processes the language in participants’ responses before running them through a natural language processing (NLP) algorithm that analyzes term frequencies to estimate their importance. This allows Remesh to surface potentially interesting topics that arise. Learn more about the algorithm used here.
How to use this data: During the Live Conversation, you may discover notable topics that you want to investigate further on-the-fly.
After the Conversation, you can filter Common Topics by Segment, or combine a custom keyword search with Common Topics. You can also see and download visuals showing the prevalence of Common Topics.
Sentiment Analysis
What it is: A way to detect the emotional tone of responses as “Positive,” “Neutral,” or “Negative.”
Where you can find it: In each individual Ask Opinion or Ask Experience response in the Analysis Results page.

How it works: Sentiment labels classify Ask Opinion and Ask Experience responses into one of three possible options: “Positive,” “Neutral,” or “Negative.” These labels are based on a numeric score applied to the entire response. Sometimes it’s more difficult to capture nuance in complex responses, which is why the Sentiment label is editable.
How to use this data: Visualize the data with the Sentiment Chart to show the emotion behind responses. This can be especially useful if you have a wide variety of responses and want to get an idea of the general feeling behind them.
How to analyze Ask Opinion responses using sentiment labels
Thematic Clusters
What it is: Thematic Clusters identify key themes among responses. And within those key themes, it answers the question, “Who are the people responding?”
Where you can find it: In each individual Ask Opinion or Ask Experience in the Analysis Results page, Thematic Clusters is an option in the ‘Group By’ dropdown to the right of the screen.

How it works: The Remesh algorithm analyzes each response to understand its meaning and how similar or different it is from other responses. You can define the number of groups you’d like to organize the responses into using the Group Slider. Each response will map to a single group.
Learn more about how this works here.
How to use this data: Identify similar themes based on full responses that go beyond individual words or short phrases (as performed by Common Topics). Use Thematic Cluster Comparison view to review and understand differences, if any, between theme group responses and the demographics of the participants who supplied them.
Ranking
What it is: Ranking questions allow participants to compare and organize a list of items in preference order.
Where you can find it: In your Analysis Results, rank questions will show two visualizations:
- A stacked bar chart showing each option’s voting distribution
- A table showing rank order and count
You can also analyze ranking during a Live Conversation.
How it works: After building your Rank question into the discussion guide or ad-hoc during a Live Conversation (more on that here), participants rank their order of preference. Your question can have 3-6 options. Based on the responses, Remesh provides three different data points:
- Absolute Rank - Position in the list: 1st, 2nd, 3rd, etc.
- Average Rank - Used to sort the list and determine an option's absolute rank position.
- Ranking Distribution - The number of participants that ranked each option in each position. Used to calculate the Average Rank.
Learn how Remesh calculates the weighted score for a Rank question here.
How to use this data: Understand your audience’s preferences and see how different audience segments’ preferences compare.