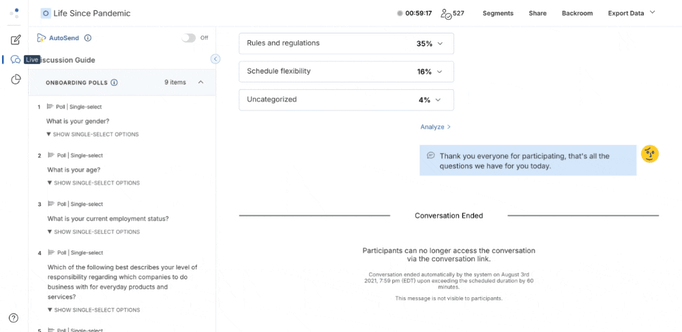
Overview
For Ask Opinion, Branching and Ask Experience questions, Thematic Clusters strive to answer two key questions relating to your participant responses:
- What are the key themes among responses?
- And within these themes, who are the people responding?
This is an incredibly powerful and time-saving tool that allows you to quickly organize and analyze your qualitative data.
Included in this article:
- How it Works
- Where to find Thematic Clusters
- Understanding Your Clusters
- Customizing Views
- Compare Themes
- Using Segments
- How should I use Thematic Clusters
- FAQs
How it Works
The Remesh algorithm analyzes each response to understand its meaning and how similar or different it is from other responses. This eliminates the process of manually identifying similar responses. As the system assigns each response into a group, it is optimizing for a best fit informed by the following ideas:
- Responses within the same group are generally similar to each other
- Responses across different groups are generally dissimilar to each other
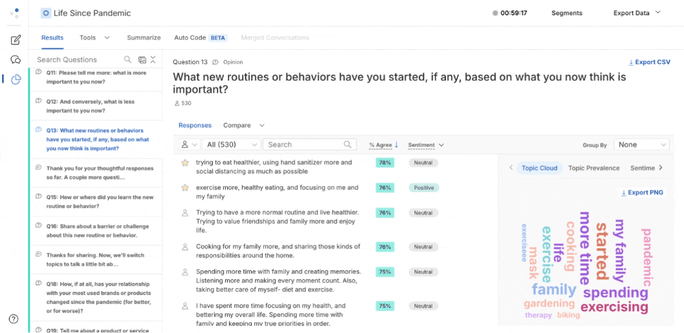
Where to find Thematic Clusters
- Navigate to the Analysis page and select the Results tab
- Choose an Ask Opinion or Ask Experience question to analyze
- Open the Group By dropdown to the right of the screen and select Thematic Clusters
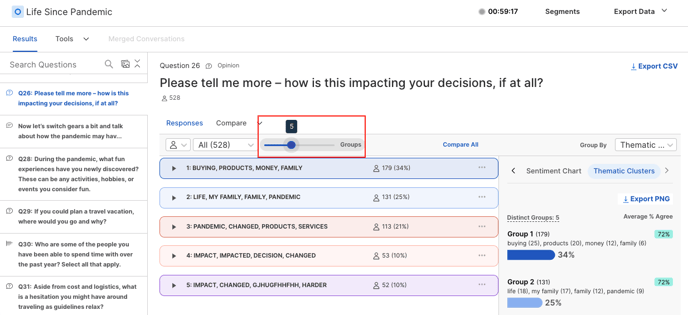
Understanding Your Clusters
Thematic Clusters will not explicitly tell you the theme of each cluster, rather provide the clusters of responses and further information to help you as the researcher determine what the theme of each cluster is. You’ll see two labels that help you quickly understand the key themes inside each Cluster:
- Common Topics: A list of prominent words or phrases that appear in responses.

Common Topics add valuable context, but sometimes there is an overlap of Common Topics between the groups, which can be confusing. Common Topics coupled with the Featured Response provides instant clarity so you can quickly understand what’s in each Cluster. - Featured Response: The response that best represents the central idea of the group for the selected segment. The Featured Response will change depending on what Segment is selected.

Customizing Views
You can customize your Thematic Cluster view by showing or hiding the Featured response or by using the group slider.
Showing and hiding the Featured Response
By default, Remesh will display what is believed to be the “ideal” number of groups based on responses and population. Using the Group Slider, you can distill it down to fewer groups or expand to more groups to instantly play with the data.
For example, if you select three groups using the Group Slider, Remesh will optimize for the best fit of all responses into three clusters. If you select four groups, Remesh will optimize for the best fit of all responses into four clusters. And so on.
Each response will appear only in one group.
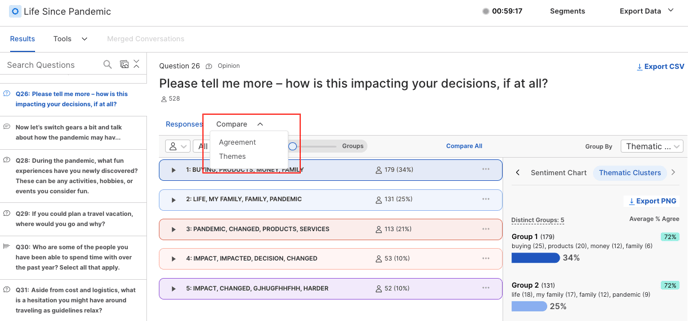
Compare Themes
- To compare themes, click Compare and select Themes from the drop-down menu.
You’ll see each Cluster, or theme, along with some key information about the Cluster:
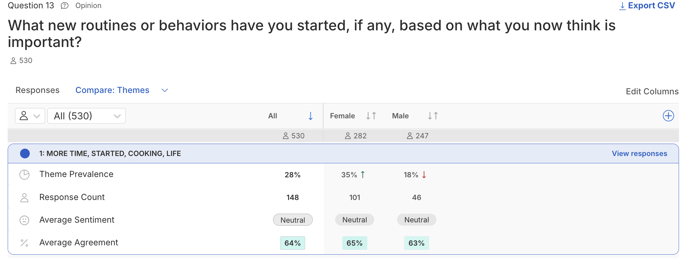
- Theme Prevalence: The percentage of people within the population who have a response that fits within the theme.
- Response Count: The number of people within the population who have a response that fits within the theme.
- Average Sentiment: Sentiment for each response is categorized as “Positive,” “Neutral,” or “Negative.” The Average Sentiment is the average emotional direction among all the segment responses that fit within the theme.
If you hover over the Average Sentiment, you’ll see a chart showing the sentiment distribution.
- Average Agreement: % Agree is an estimate of the percentage of participants that agrees with each response. The Average Agreement is the average of all % Agree scores for all responses within the theme, from the perspective of the selected segment.
If you hover over the Average Agreement, you’ll see a chart showing the agreement distribution, grouped into 10% bands.
Using Sements
There are two different ways you can utilize Segments when analyzing Thematic Clusters. You can compare Segments or cut the data using Segments.
Comparing Segments
- From Compare > Themes, click the ‘+’ button in the right corner of the themes display.
- Select the Segments you want to compare and click ‘Done’
- The Segments will now appear as columns in your themes display, so you can compare the Segments to each other and to the Clusters as a whole.
-gif.gif?width=682&height=483&name=Thematic%20Clusters%204%20(1)-gif.gif)
- From either view, you can utilize the drop down to cut your data using segments. This will generate a new set of Thematic Clusters for that specific segment.
How to use Thematic Cluster data?
Use this data to identify similar themes based on full responses that go beyond individual words or short phrases (as performed by Common Topics). This works best when participants supply rich, thoughtful, open-ended responses.
How should I use Thematic Cluster Comparison view?
This allows you to review and understand differences, if any, between theme group responses and the demographics of the participants who supplied them.
Use this view to see how segments contribute responses towards each theme (“how many or few”). Also use this to compare spread of sentiment and agreement side by side. A simple way to do this is to 1) add related segments into view and 2) scan across the row to note differences in sentiment and agreement.
Frequently Asked Questions
- What is a Cluster?
A Cluster represents a possible theme, or theme idea. - What question types can use Thematic Clusters?
Ask Opinion, Branch Opinion and Ask Experience questions. - Can responses appear in more than one Cluster/Group?
No, each response will only appear in one Cluster. - What is the grouping logic used for Thematic Clusters?
Thematic Clusters is powered by a clustering algorithm. Given the number of clusters/groups (either the default or as set by the user), the system assigns each response into a group. It is optimizing for a best fit informed by the following ideas:- Responses within the same group are generally similar to each other
- Responses across different groups are generally dissimilar to each other
- How is the Thematic Cluster Comparison view organized?
Summarized information about the responses within each cluster/group are shown by segment, and includes details like segment size, sentiment, and agreement (for Ask Opinions and Branch Opinions). - What is Theme Prevalence?
The percentage of a segment represented within a specific theme. - How is the Average Agreement score calculated?
It looks at the responses within a theme and averages out the agreement for all the responses from the perspective of that segment. - How is the Average Sentiment label calculated?
It looks at the responses within a theme for a specific segment and averages out the sentiment for those responses. - What languages is Thematic Cluster available for?
You can review our which languages support Thematic Clusters here! -