Overview
Continue analyzing response data captured via Ask Experience questions after your conversation has ended.
As a refresher - Ask Experience questions are open-ended questions in which participants type and submit their responses and select the categories that best describe them. Read more about Ask Experience questions here.
How it works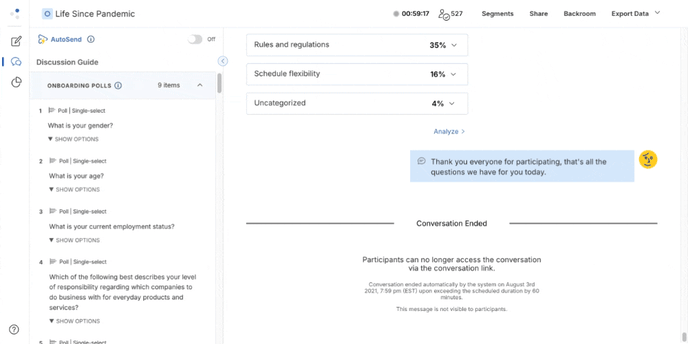
-
Navigate to the Results tab on the Analysis page
- Select an Ask Experience question to analyze.
- By default, the responses are organized by Category names. You can also organize them by the Sentiment labels or Thematic Clusters.
- Cut and filter responses by Segments, Sentiment labels, Categories, Common Topics, or manual keyword search.
Customizable and Exportable Visuals
Four visuals can be customized and exported as PNGs.
1. Category distribution bar chart

2. Common Topics word cloud

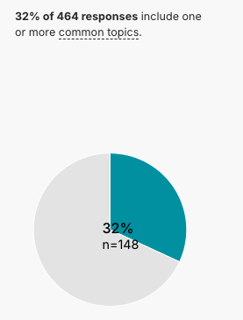
3. Common Topics prevalence pie chart
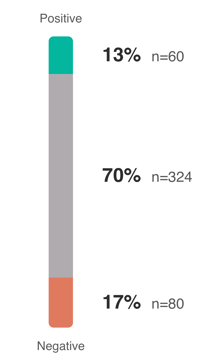
4. Sentiment label distribution graphic
You can also export the response data for the selected question as a CSV file.