![59b7eb52c29cb1fb87e1bba7bf1ef88c41152899.png]](https://help.remesh.ai/hs-fs/hubfs/59b7eb52c29cb1fb87e1bba7bf1ef88c41152899.png?height=40&name=59b7eb52c29cb1fb87e1bba7bf1ef88c41152899.png)
Remy can run statistical tests on your Poll and Ranking data directly in the analysis chat. Ask for a comparison, a correlation, or a specific test in plain language. Remy pulls the participant-level counts, computes the result, and reports it with citations to the source data.
This feature applies to Live and Flex Conversations with Poll or Ranking data. Learn about Remesh product offerings. For an introduction to the analysis chat, see Using Remy for Analysis.
Statistics are computed, not estimated. Remy runs every test through a statistics engine on the exact response counts in your Conversation. When the data needed for a test is not available, Remy says so and offers the closest valid alternative.
Included in This Article
- What You Can Test
- How to Ask
- What Remy Returns
- Good to Know
- Troubleshooting
- Frequently Asked Questions
What You Can Test
|
Your question |
Test Remy runs |
|---|---|
|
Do two groups differ on a scale question? |
Welch's t-test (or Student's t-test on request), with Cohen's d |
|
Do three or more groups differ? |
One-way ANOVA, with Tukey HSD or Bonferroni post-hoc on request |
|
Does the score climb or fall across ordered groups (age bands, tenure)? |
Linear trend contrast |
|
Same comparisons, but treating the scale as ordinal? |
Mann-Whitney U (two groups) or Kruskal-Wallis H (three or more) |
|
Does the overall score differ from a benchmark or midpoint? |
One-sample t-test |
|
Are two categorical questions related? |
Chi-square test of independence, with Cramer's V |
|
Does the share choosing one option differ between two groups? |
Two-proportion z-test |
|
Does the response split differ from what I expected? |
Chi-square goodness of fit |
|
How strongly do two scale questions move together? |
Spearman's rho (default for Likert) or Pearson's r |
|
How do several questions correlate with each other? |
Correlation matrix, 2 to 8 questions |
|
What are the counts and percentages, with a margin of error? |
Frequencies with 95% confidence intervals |
If you are not sure which test you need, describe the comparison. Remy picks an appropriate test and names it in the answer.
How to Ask
One message is enough. Name the question (by number or text), the segment or second question, and optionally the test.
- Is the difference between Managers and Individual Contributors segments on Q4 significant?
- One-way ANOVA on Q6 across the Region segment. If significant, run Tukey HSD.
- Chi-square between Q3 and Q9.
- Correlation matrix for Q5 through Q9.
- Does confidence in AI tools rise with age band?
Follow-ups keep context. Now run the post-hoc or Repeat that for Q8 works without restating the setup.
You can also ask for analysis step by step, outlining the distribution by group first, then the means, then the test.
What Remy Returns
Every statistical answer follows the same layout:
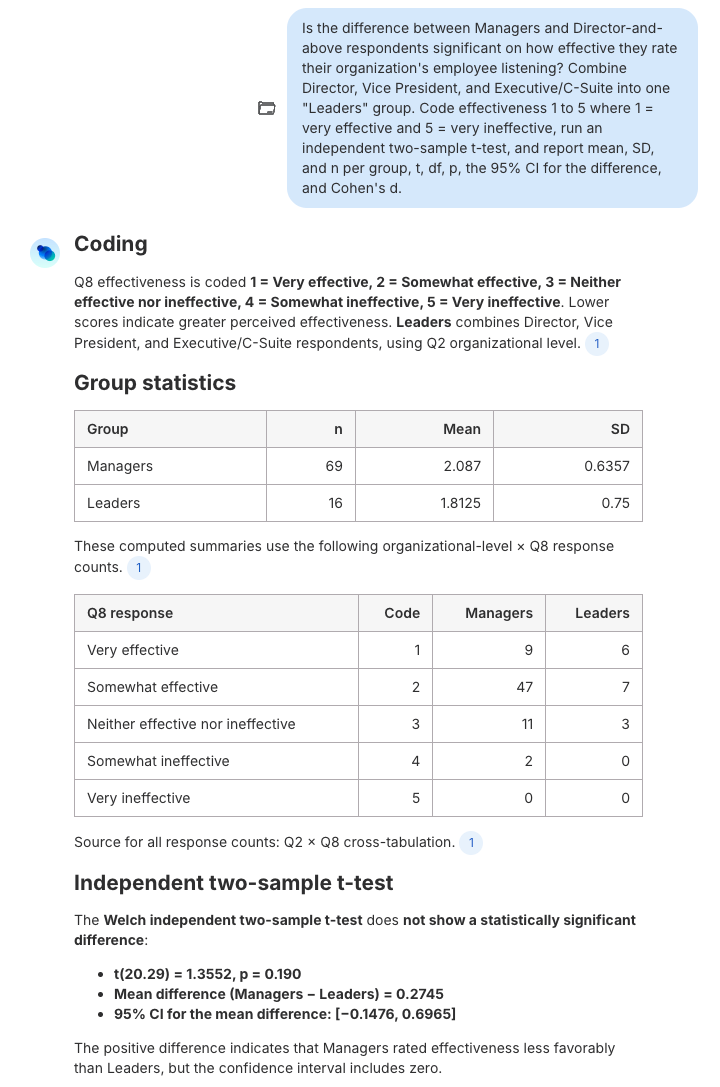
- Coding. How options were converted to numbers, which options were excluded, and the resulting n.
- Group statistics. n, mean, SD, and relevant percentages per group, with citations to the source tables.
- The test. Statistic, degrees of freedom, p-value, and 95% confidence interval.
- Effect size. With a small, medium, or large label.
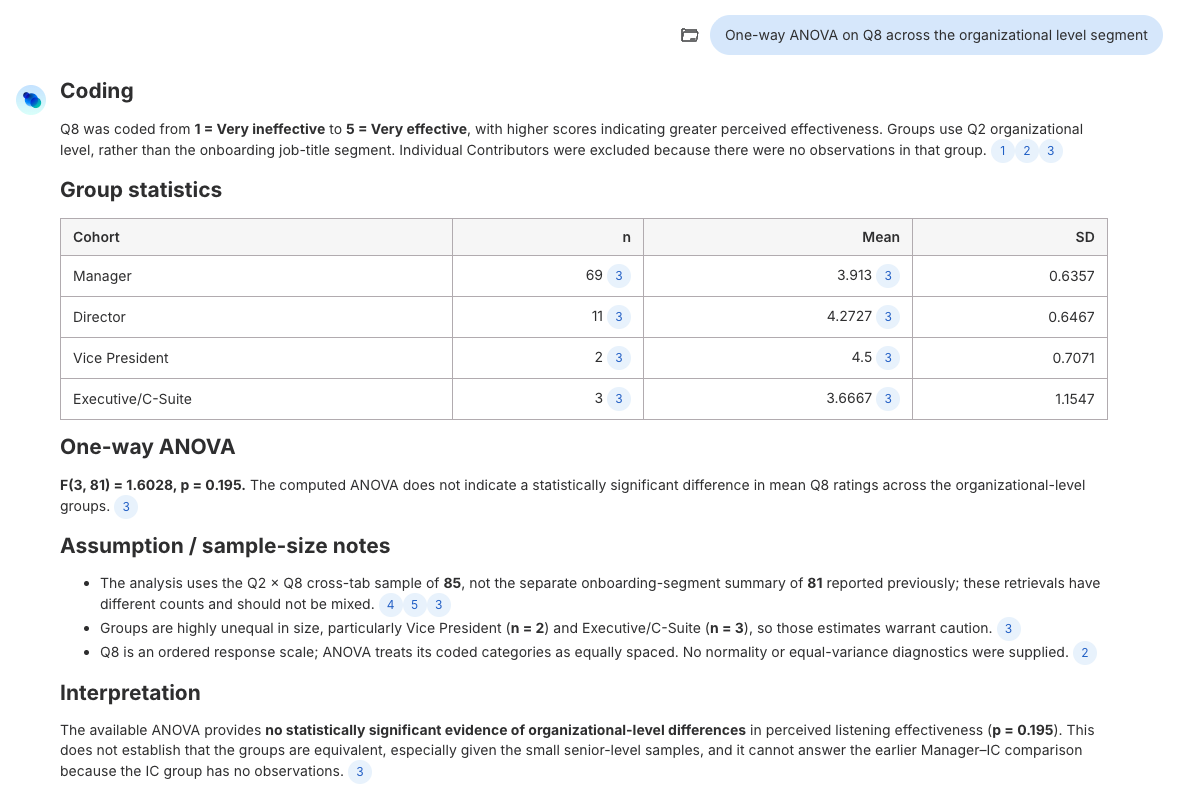
- Assumption and sample-size notes. Groups under 30, ordinal-scale caveats, Welch versus Student, and any engine warnings.
- Interpretation. One to three plain-language sentences anchored to the numbers above.
When a test cannot be run, Remy replaces step 3 with Why this cannot be computed, What would be needed, and Closest substitute available, and runs the substitute in the same answer.
Good to Know
- Scale coding. Likert-style Polls are coded 1 to k in option order. "Don't know", "N/A", and similar options are excluded unless you ask to include them. To use a different coding, state it in your prompt.
- One segment per test. Group comparisons use one segment at a time. Compare by Gender in one test and by Department in another.
- Two-way ANOVA is not available. It needs per-cell summaries that segment data does not provide. Remy runs a one-way ANOVA for each factor instead and says the interaction cannot be estimated.
- Chi-square needs a real crosstab. Remy builds it from participant-level data. If expected cell counts are sparse, Remy merges the thinnest categories, reruns, and reports both.
- Correlation matrices cover 2 to 8 single-select Polls or Rankings. Multi-select Polls and MaxDiff questions are left out and listed in the answer. A single crosstab covers up to 3 questions.
- Small groups are flagged, not refused. Remy computes the test and notes any group under 30.
- Open-ended questions are not testable. Use Percent Agree, Sentiment, and Themes, or ask Remy for a qualitative comparison across segments.
Troubleshooting
- Remy refused the test and ran something else. The data for that exact test is not in the Conversation, usually a two-way ANOVA or a chi-square without a true crosstab. The substitute Remy ran is the valid alternative.
- The n is lower than my participant count. Non-substantive options are excluded and skipped participants are not counted. Ask Remy to include a specific option if you want it in the sample.
- A question is missing from my correlation matrix. Multi-select and MaxDiff questions cannot be rank-correlated. Ask for a crosstab or chi-square on that question instead.
- Remy used the wrong group. Check the assumption notes for the label it mapped to, then restate with the exact segment name from your Conversation.
Frequently Asked Questions
- Are the statistics computed or estimated? Computed. Every number comes from the statistics engine, and Remy checks each draft answer for statistics that did not come from the engine before sending it.
- Which t-test is the default? Welch's, which does not assume equal variances. Ask for another (e.g., Student's) if you need it.
- Can I compare two Conversations? Only when both have comparable coded variables. Otherwise Remy reports each separately. Merging the Conversations first gives you one sample to test.
- Can I use custom segments? Yes. Use the segment and group names exactly as they appear in Analysis.
- Are the results repeatable? Yes. The same question on the same data returns the same statistics.
- Can I get a chart? Yes. Ask Remy to visualize the group means or the crosstab alongside the result.
- Is this available through the Remesh MCP Server? Yes. The crosstab, quantitative stats, and correlation matrix tools are exposed to MCP clients. See Remesh MCP Server.
- I found an issue or have feedback. File a support ticket.